
3 analytics tools to monitor firm expenses

What’s the fastest way to tell where all your firm’s expenses are going? Should you get an assistant to trawl through all your accounting books for several hours in order to come up with a few answers? Or is it better to use advanced computing to cut down on time spent doing such a task?
If you count yourself in the latter category of people who want fast and precise analytics showing where their firm is spending money, then uLaw insights and analytics might be the right piece of software for you to be using.
Throughout the course of your firm’s activities, uLawPractice gathers and collates your firm’s financial data in its secure cloud storage network. This data can be recalled at any time with the use of your cellphone. Android and iPhone users can navigate to the following path to produce up-to-date statistical analysis of their firm’s expenses:
Accounts->Hit the ”?” in the top right corner->navigate to “Choose Category” located at the top to see the various areas where expense analytics can be drawn from.
Here are three tools you can use for advanced law firm expense analytics
1. Expense Chart by Client:
With an Expense Chart by Client, lawyers can surmise the percentage of outgoing expenses going towards particular clients.
For example, Mr. Zachary can be seen swallowing up 17 per cent of expenses. Is he worth it? These are the sorts of questions one can ask him/herself with the use of such analytics on the go.

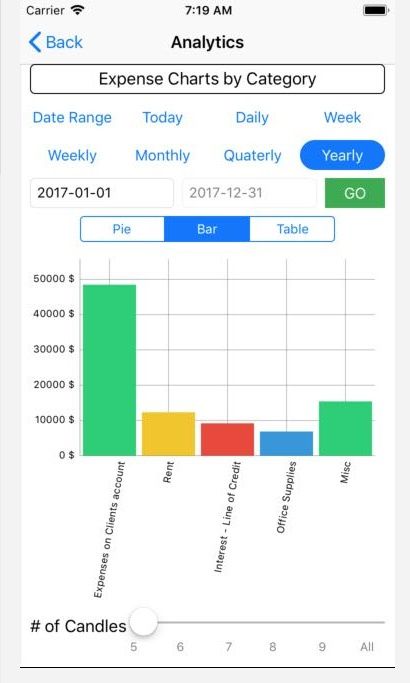
2. Expense chart by category
Expenses aren’t all the same, and therefore different categories of outgoing expenses are drawn up in uLawPractice and can be recalled by the click of a button for you to observe whether one particular area is disproportionately taking up more money than others.
For example, in the bar chart located below, you can have a look at some of the firm’s highest costs from Jan 1 2018 to the present date. Custom date ranges can easily be set with the menus located in the centre of the analytics section of uLaw mobile.

Almost all charts are available in line, pie, and bar graphs depending on a user’s preference.
3. Expense uLaw InSights
To quickly find out the sum of all outgoing expenses in any given date range, users can navigate to “Expense uLaw InSights to get the right amount. No calculations or arithmetic is necessary, and this information can be produced instantaneously.

As you can see, the firm pictured here has already spent $16,714/72 from Jan 1 to the end of the first quarter. With this information a law firm can decide if costs need to be slashed in order to remain profitable depending on cash flow throughout the remainder of the year.
More reading:
Many other features are available to mobile users who want to take a peek at how their firm is performing with our mobile analytics addition, which is already implemented for users. You can watch a video we produced on this by clicking here.