
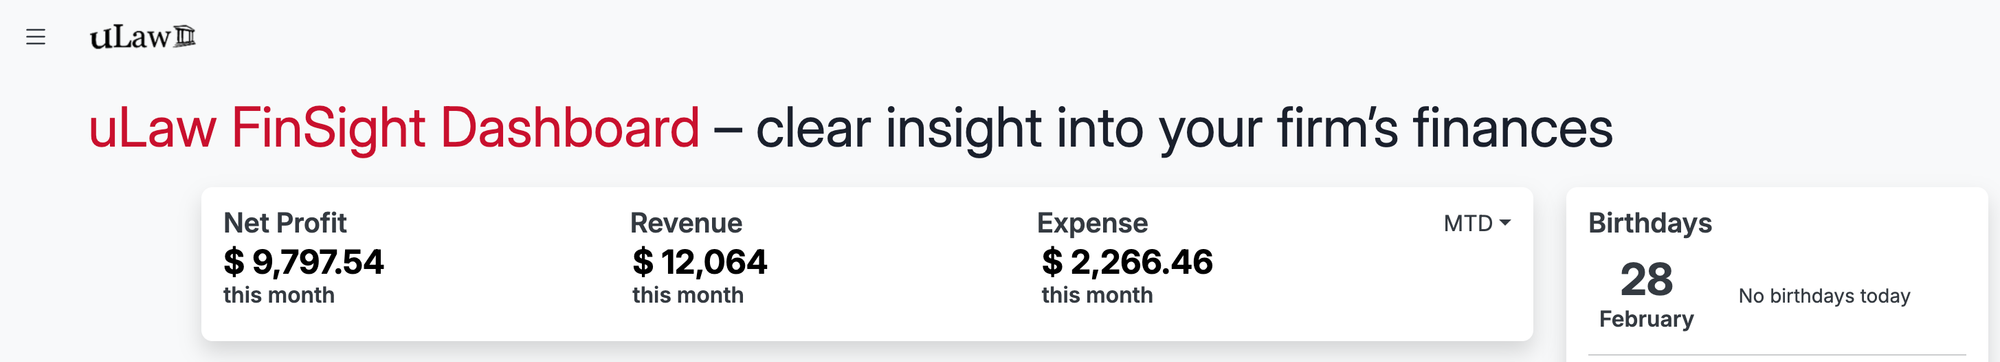
uLaw FinSight: revenue visibility in our law firms
[ This article is the second installment on our blog series deep-dive about uLaw's FinSight dashboard]
For many Canadian legal professionals, revenue is often treated as a backward-looking number. It shows up after invoices are sent, after trust transfers are reconciled, and sometimes only when the accountant or bookkeeper prepares year-end statements. This is an archaic approach that is increasingly outdated.
A truly modern practice management/accounting system is collecting operational and financial data continuously. And we no longer need to wait for a calendar year to complete before haphazardly glancing at this (contextually limited) number during tax season.
With the tools that exist today, revenue can be observed as a live management signal instead of a historical artifact. This is precisely why uLaw's software engineering team recently implemented a visual representation of metrics on its new FinSight Dashboard.
uLaw’s own recent writing on profit and loss makes the broader point well: financial performance in a law firm should be visible throughout the year, not only at year-end.
Revenue!
Revenue comes in many shapes and sizes, and from different sources. Each law firm will have different statistics spread across the year regarding its revenue. With uLaw's FinSight dashboard, we can see more than just a simple chart of revenue.
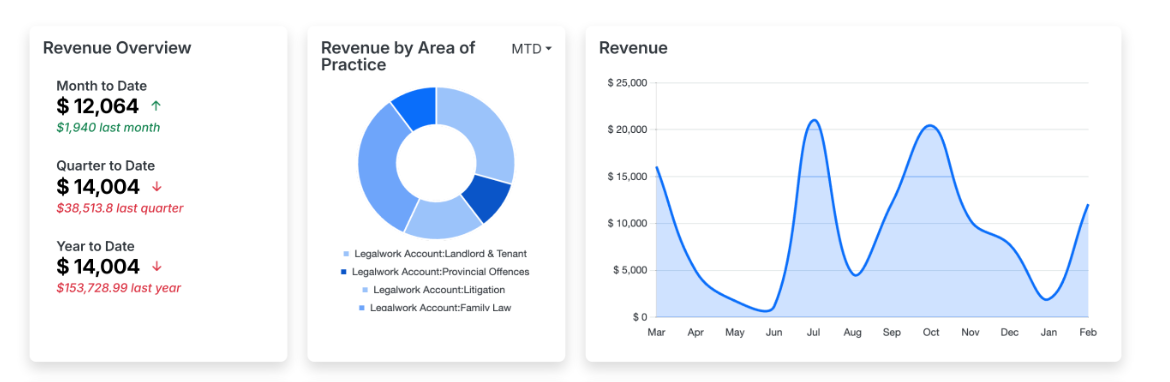
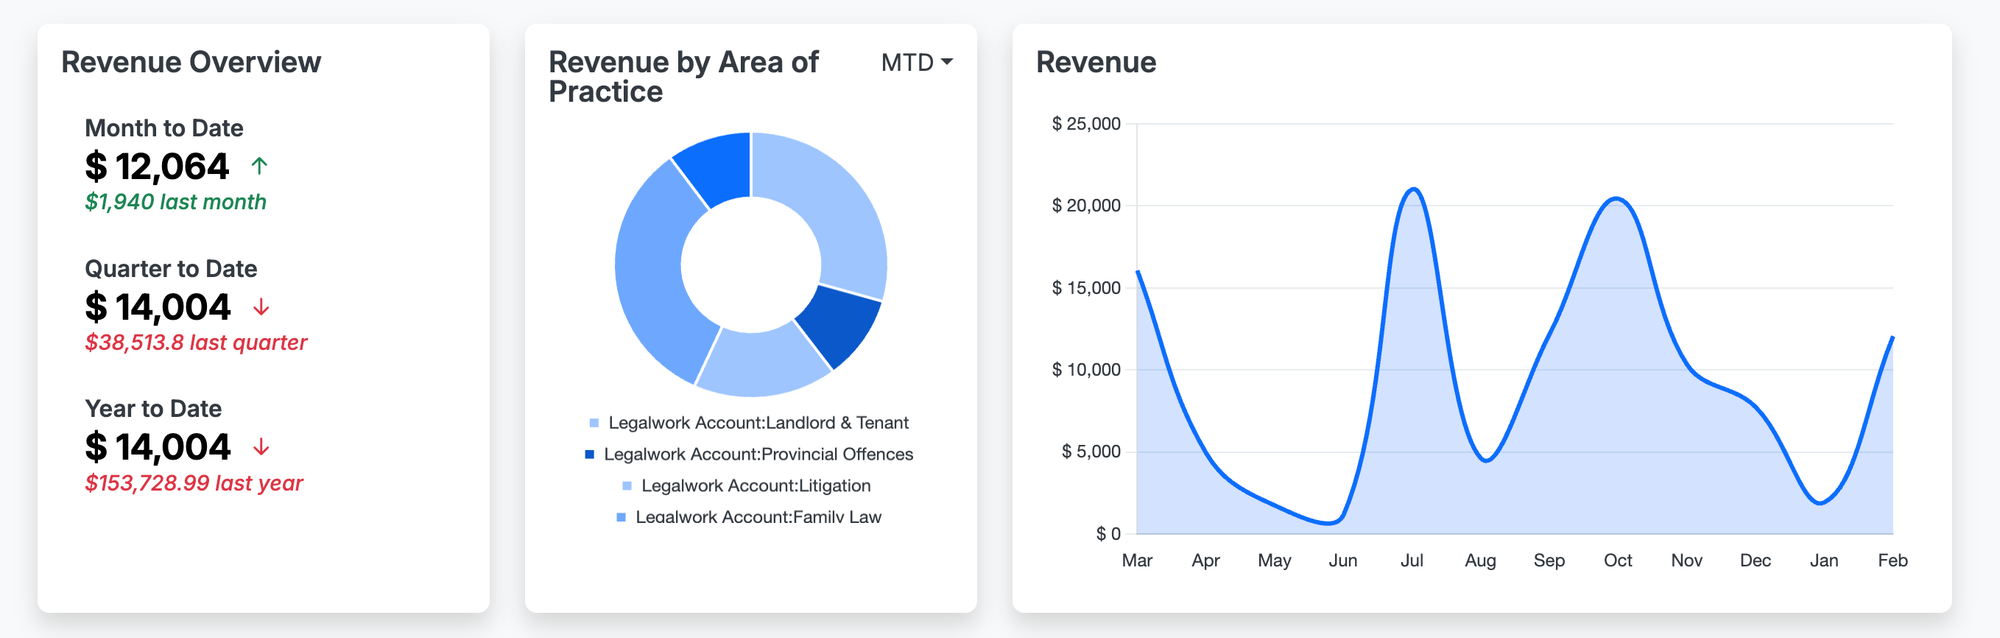
Within these three cards in uLaw's FinSight dashboard, we see a breakdown of revenue for a mock law firm. Together, they form a compact analytical model, which converts ordinary bookkeeping traces of a law practice into a decision-making surface. Later in the post we will go into greater detail.
In practical terms, it lets a lawyer see not only how much revenue the firm has generated, but also when that revenue is occurring, which practice areas are driving it, and whether current performance is trending above or below earlier benchmarks.
In accounting, revenue is the amount earned from providing services before expenses are deducted. On an income statement, it sits at the top line. For a law firm, that usually means fees earned from legal work rather than net profit, cash in the bank, or trust balances.
[Accounting guidance also distinguishes revenue from profit. Profit is what remains after operating costs, payroll, subscriptions, occupancy, insurance, and other expenses are subtracted. We have a previous post on this subject here ]
That distinction matters because a firm can appear busy and still be financially weak. A month with strong billings may not produce strong profitability if realization is poor, write-downs are high, or overhead is heavy. Revenue is therefore not the end of the financial story, but it is the first and most important operational signal.
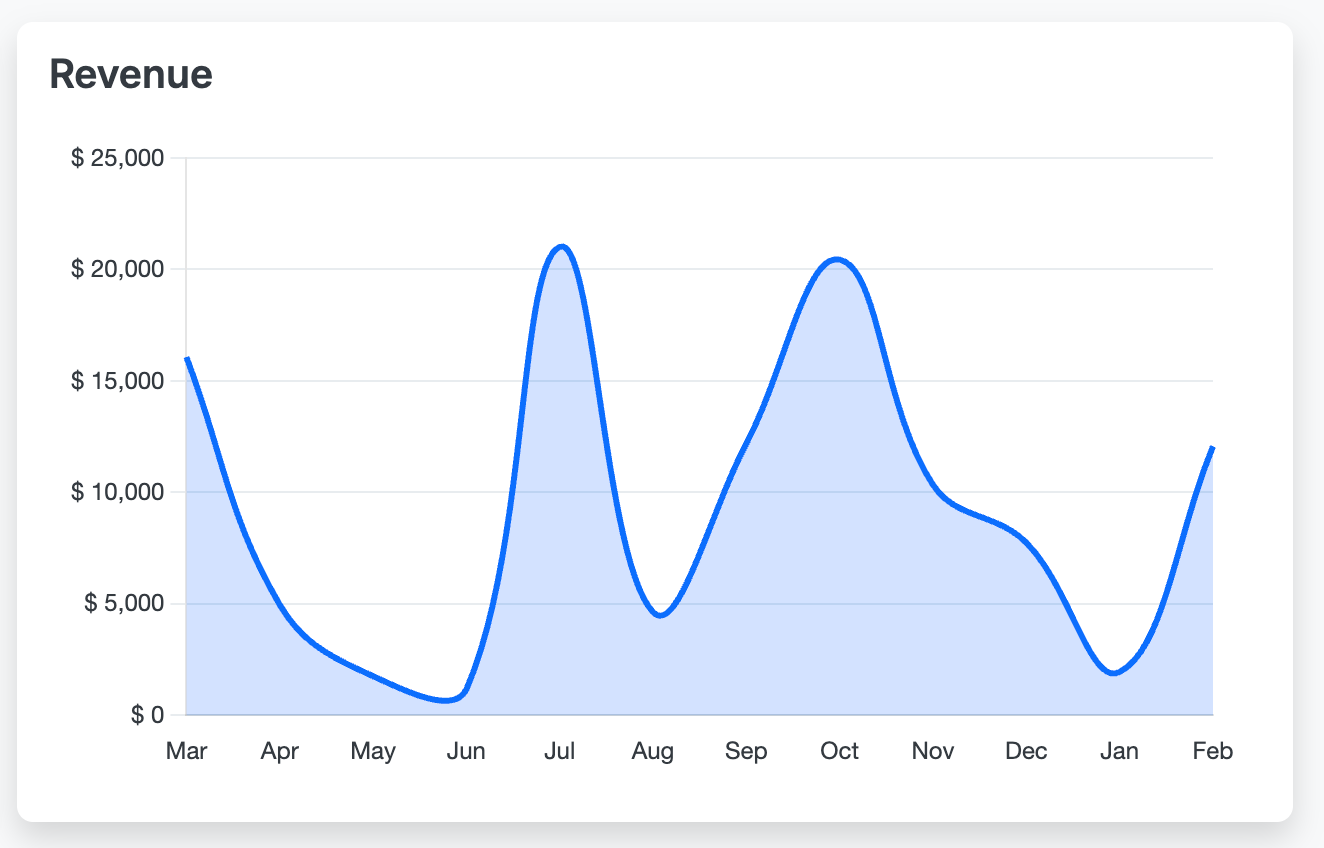
Think back to our previous example, where the law firm (according to the observable charts found in the dashboard) appears to be generating no revenue over the course of several months. There may be a very clear answer as to why this may be happening.
There is also a second distinction that matters in software-driven legal accounting: revenue is not always identical to cash receipts. Under accrual accounting, revenue is recognized when it is earned, which can differ from the date cash is received. In other words, work performed in one period may be recognized as revenue in that period even if payment arrives later. This is one reason dashboards are so powerful. They can help practitioners see timing differences that would otherwise remain hidden in a bank balance.
What hat are you wearing today?

Many professionals across Canada are increasingly adopting hybrid roles. Depending on the time of year, or day, a lawyer may be forced to wear several 'hats', depending on the task that is afoot. For small or solo legal practitioners, this can mean that a lawyer or paralegal may be simultaneously behaving as a legal accountant or bookkeeper at the same time as advocating for their clients. This balancing act aligns quite well with practical legal software, since it guides a practitioner to produce the books and records that they require in order to remain compliant with regulators.
Our point in this blog is not to overwhelm lawyers with abstract finance. We want to merely underscore that timely and useful information can be derived from data. At the end of the data, if data can be used to support better management of one's time and finances, then it should be used! This is why our engineers produced this sleek dashboard design.
A well-designed dashboard reduces the distance between transactional data entry and managerial interpretation. Instead of waiting for a formal report, the practitioner can observe emerging patterns in near real time.
Reading the “Revenue Overview” Panel Properly
Here we will zoom in on one of the cards in the FinSight Dashboard. Every user will have different stats, but the parameters for what this card shows will remain the same.
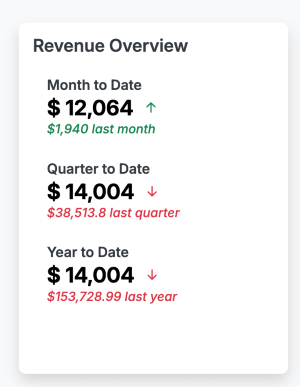
The left-side Revenue Overview panel shows three familiar accounting lenses: Month to Date, Quarter to Date, and Year to Date. These are not cosmetic labels! They are time-bounded analytical windows, and each tells a different story.
Month to Date (MTD) isolates performance within the current month. This is useful for short-cycle monitoring. It answers questions such as: Are invoices actually being generated this month? Is the firm pacing toward a normal billing month? Has a slowdown emerged early enough to respond?
Quarter to Date (QTD) gives a slightly broader management view. Quarterly framing is helpful because legal work often clusters unevenly. A slow month may be entirely normal if the surrounding quarter remains healthy. QTD smooths some of the noise and is often more useful than daily or weekly fluctuations for strategic review.
Year to Date (YTD) captures the cumulative revenue earned since the start of the fiscal or calendar year. This is often the most important management measure because it reveals directional performance over time and supports comparison against prior-year results.
Accounting literature treats monthly, quarterly, and annual reporting periods as legitimate ways of structuring financial observation. Monthly periods are especially useful internally for management, even when external reporting is less frequent.
In the screenshot, the Year to Date figure is shown as $6,670.73, accompanied by a comparison against $36,807.15 last year. That comparison is critical. A standalone number is descriptive. A comparative number is diagnostic. It allows the user to detect variance. These numbers could be precisely what a practitioner expects. They could also point that something is awry. This all comes down to the unique makeup of a law firm and the function it provides to clients throughout the year.
The Red Arrows!

The downward indicators in the panel represent negative variance versus a prior benchmark. In plain terms, the dashboard is telling the user that current performance is trailing the comparable prior period.
This is where good software stops being a passive record and starts functioning as a business intelligence layer. A red arrow is not just a warning. It is a prompt for inquiry:
- Is the decline seasonal?
- Has work shifted from one practice area to another?
- Are invoices being raised later than usual?
- Has collection timing changed?
- Has matter intake fallen off?
- Is there a change in pricing, realization, or file mix?
A sophisticated legal practitioner should resist the impulse to read a decline as purely good or bad. A variance is a signal, not a verdict. Data analytics, in this context, means investigating the drivers behind the number rather than reacting emotionally to the number itself.
Revenue by practice area: the built-in data segmentation tool
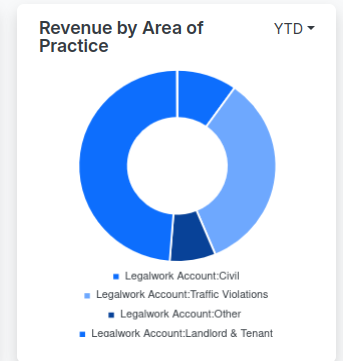
The donut chart in the center, labeled Revenue by Area of Practice, is one of the most useful parts of the visuals found in the dashboard. With respect to revenue, it is segmenting total revenue by its category; which in the screenshot includes Civil, Traffic Violations, Other, and Landlord & Tenant.
From an accounting perspective, this is a form of revenue classification. From a data analytics perspective, it is categorical segmentation. The dashboard is taking one aggregate measure, total revenue, and decomposing it into its contributing sources.
This matters because not all revenue is equally strategic. A practice area may generate high gross fees but poor margins, delayed payment, or operational strain. Another may generate lower gross revenue but better turnaround, cleaner collections, and stronger repeat client potential. Segmentation helps a firm ask better questions:
- Which area is producing the strongest share of earned fees?
- Which area is stable versus volatile?
- Which category appears over-relied upon?
- Which practice area deserves more marketing attention?
- Which area may need tighter billing discipline?
This is a classic business intelligence move. Once revenue is broken out by category, the lawyer can move from simple reporting to portfolio analysis. The practice stops looking like one monolithic business and starts looking like a set of service lines with different performance characteristics.
Revenue Line Chart: Our Trend Model
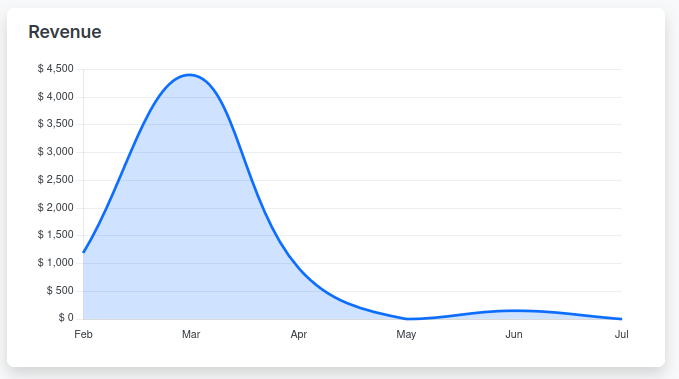
The right-side chart plots revenue over time, by month. In the image, the curve rises sharply into March, falls through April and May, and then shows only a modest bump in June before tapering off. Even without advanced statistics, this is useful trend analysis.
Trend visualization helps users distinguish between isolated events and recurring patterns. A single strong month can feel reassuring, but a multi-month decline after a peak may indicate that a March surge was exceptional rather than sustainable. A graph makes that visible instantly.
This is where the language of analytics becomes useful:
- Trend refers to the general direction over time.
- Volatility refers to how uneven or unstable the monthly values are.
- Seasonality refers to recurring patterns tied to calendar timing.
- Variance refers to deviation from a benchmark.
- Concentration risk refers to over-dependence on one category or revenue source.
Legal professionals do not need to become data scientists to benefit from these concepts. They simply need dashboards that translate transaction history into readable patterns. Microsoft’s analytics documentation describes modern BI platforms in similar terms: connect data, model it, and turn it into actionable insight through dashboards and reports.
Be sure to subscribe to our blog for more information on how to properly analyze the health of your law firm. Also, uLaw routinely has CPD accredited webinars which delve into similar topics.